European
Power Analytics
Power Analytics
Use our fundamental model to project negative prices in the day ahead markets
How will negative prices develop in the future? This question has implications for the operational strategies of renewable assets such as curtailment for instance, while optimizers of flexible assets can capitalize on this opportunity.
So, will their occurrences grow hand-in-hand with the additional rooftop solar capacity which is not exposed to the day-ahead market prices? Or will they reach a ceiling with the roll-out of BESS capacity and the phase-out of renewable subsidy payments in the event of negative prices, like in Germany for instance?
Our in-house fundamental power market model takes these factors into account to provide reliable forecasts of occurrences of negative prices.
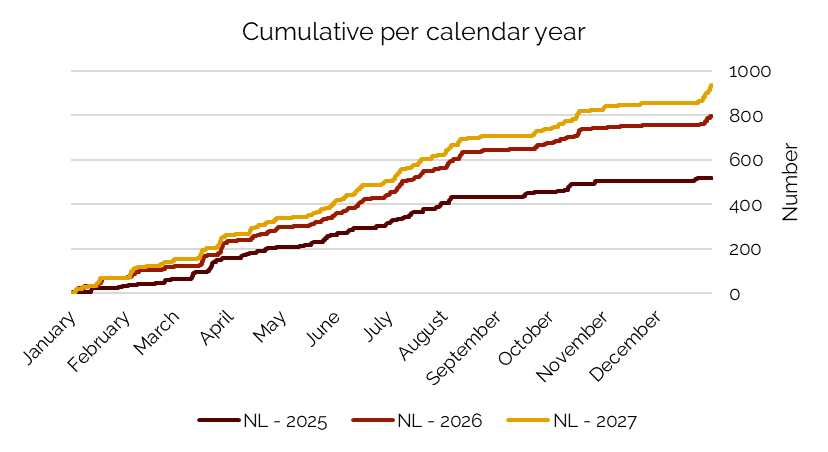
The occurrences are reported as the number of negative hours in three different windows:
To provide an insight on the magnitude of the negative prices we also report the average negative price of these events in EUR/MWh for each of the three windows.
The data sources used for this metric are the day-ahead hourly historical price series from EPEX, Nordpool, OMIE, and other publicly available price data sources per market.