European
Power Analytics
Power Analytics
Do you need help evaluating your PPA or BESS projects?
The KYOS Capture Rate Index reports the value captured by renewable generation (solar, onshore and offshore wind). It is expressed in absolute terms (Capture Price in EUR/MWh) and relative to the average baseload price of their respective markets (Capture Rate in %, default).
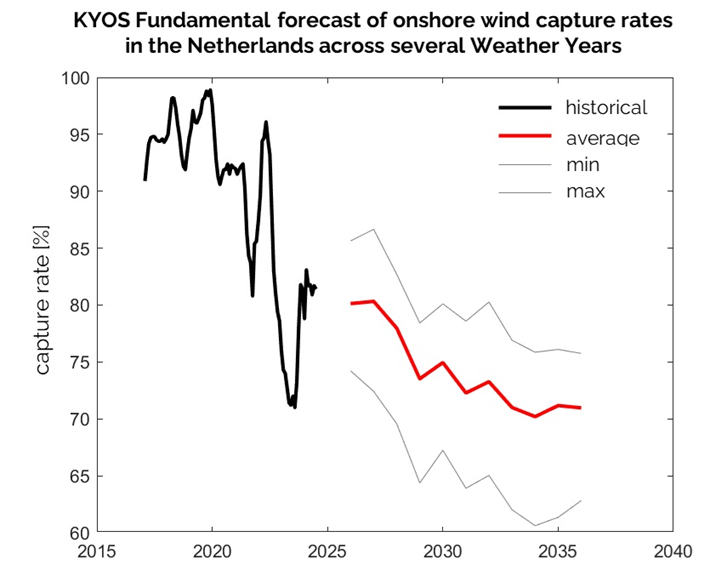
Whether you are a renewable energy producer managing your future revenue risks or an investor evaluating the viability of wind and solar projects, understanding how capture rates are likely to evolve is a critical foundation for making informed and strategic decisions.
In fact, the price captured by a wind or solar farm in the future is influenced by the deployment of additional renewable capacity, which can reduce revenues through cannibalization. At the same time, actual weather patterns will determine the shaping outcomes.
Our in-house fundamental power market model takes these factors into account to provide reliable capture rate forecasts.
Want to get a clear perspective on future capture rates? Get in touch with us here.
The data sources are:
for the rolling yearly index we report the capture prices and capture rates of the latest 12 months on each period. This means, for example, that for June 2024 we use data between July 1st 2023 and June 30th 2024.
for the monthly index we report the capture prices and capture rates within a specific month in a year. Using the same example as before, for June 2024, we use data between June 1st 2024 and June 30th 2024.
We enable the assets to curtail under negative power price events. This means that for hours when prices are negative the cashflow is zero, while the volumes for these hours are still accounted for.
The advantage of this methodology over using historical generation data per country goes in two directions. First, our methodology is not sensitive to changes in national installed capacities which deviates national capture rate indicators significantly depending on the market trend and the magnitude of the fleet changes. Second, our methodology is not affected by disruptions, maintenance, behind-the-meter phenomena, and other availability issues which might affect the indicator. Our methodology is more suitable for investors willing to understand the potential capture value from an asset operating in a specific market in a specific moment in history. For estimations of these indicators in the future please contact us so we can present you with our wide analytical portfolio able to adapt to your specific needs.